")
")
How Does A Particle Size Analyzer Measures & Report?
If all the particles in the world are as round as a table tennis ball, then it is simpler to measure or describe the size. One can simply measure diameter and get an approximate statistical results by a microscope. However, in the real world, the particles are not like this. Under a SEM, the particles usually appear irregular.
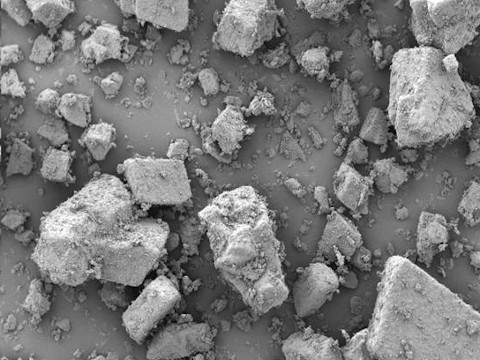
Particles Viewed By SEM
For the majority of non-spherical particle samples, if you wanted to accurately describe the appearance size, you could only use an electron microscope combined with automatic image analysis technology. And you have to describe the particle size with multiple conditions, such as the longest/shortest diameter, perimeter, projected plane area, etc. However, for the analysis of thousands, millions of particles in a sample, it is obviously impractical to describe the appearance size of particles one by one. Finally, an average particle is needed, and the average size will be easier understanding by others who will read the report.
For the scientific analysis of particle size, except some extreme samples, such as fibers, which has large aspect ratios, the others could be sizing by the equivalent sphere diameter. Even though it is a general way to do, the particle size of the sample powder is usually not consistent. The particle size is typically in a certain diameter range. The largest particles to the smallest particles in the powders usually have a certain difference, even more than several times. Besides, the number of particles in each size range are not the same. Thus, no matter Laser Diffraction method, or other non-microscopy particle size measurement methods, are not measuring the individual particles, but they are the result of macroscopic measurement.
Therefore, the measurement results of a particle size analyzer are presented in a way like statistical Gaussian distribution. The size of particles are described in a particle size distribution diagram. A curve of size distribution diagram is presented. Then, several statistical dimensions of size can be marked out from the diagram, such as D10 D50 D90. Or the average particle sizes by these four expression D[4,3], D[3,2], D[2,1], D[1,0] from formulas. By the above statistical calculations, you and others could understand the size characteristics of the sample from the report.
ACTTR Technology brought to you the mainstream Particle Size Analyzer in the world, with variety of exclusive innovative technologies. For more details, please contact ACTTR Technology. We’re more than happy to serve you!