")
")
Test and Measure Viscous Substances By FTIR

Service oils, like Castrol's Magnatec engine oil is an indispensable substance. In many mechanical operations, such as automobiles, aircraft engines, or motors and engines, service oil are used to lubricate parts and minimize the wear of parts during operation. Over time the oils pick up elemental metals, soot and other contaminants which visibly spoils the oil. Spectrometers are used to detect which pollutants are in the oil and determine which chemical degradation has occurred.
An infrared spectrometer (FTIR) is a common instrument for the related detection. However, ATR analysis method of FTIR attenuated total reflection is not sensitive enough to find early signs of chemical degradation.
ATR analysis is typically not sensitive enough to pick out the early signs of this degradation, requiring the larger effective pathlength of a transmission measurement to determine. However, the traditional a vertically mounted cell was the go-to method for loading viscous or sticky fluids. However, this approach leads to problems with sample loading, consistent pathlengths, and cell clean-up. Each time the sample is measured, the entire sample cell must be disassembled, cleaned, and refilled. As a result, it is almost impossible to precisely and repeatedly control the optical pathlength.
SPECAC Ltd. a professional FTIR / XRF accessories vendor in United Kingdom has designed a liquid sample cell, Pearl ™ holds the innovative horizontally mounted Oyster™ cell, consisting of two precision machined window holders which match to provide a highly repeatable pathlength without the use of spacers. Pearl ™ liquid sample cell ensures that each infrared spectrum measurement can maintain a fixed optical path length and perform precise quantitative analysis.
The below figure compares the spectra of fresh and used Castrol Magnatec oil samples using a 25 µm pathlength. Very little sample (< 5 ml), was needed to quickly differentiate the oils. The used sample shows clear evidence that the oil has been chemically altered and presence of contaminants.
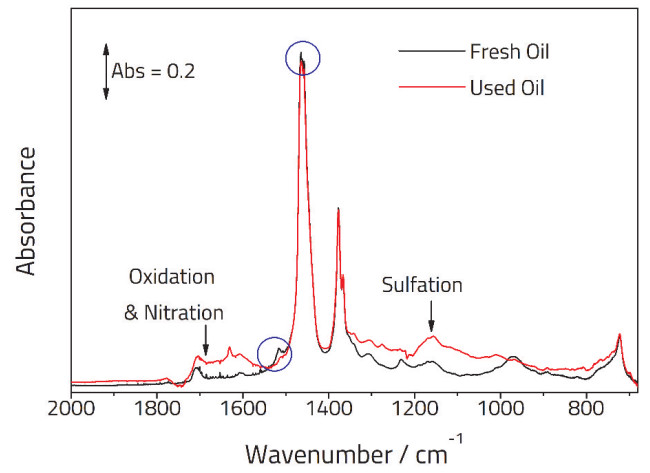
Evidence of sulfation is observed by the growth of bands around 1150 cm-1, while the 1600 – 1700 cm-1 region shows evidence of oxidation and nitration in the oil. There is a loss of relative signal intensity at ca. 1500 and 1460 cm-1. This is marked by blue circles and indicates a decreased concentration of the original oil in the used sample.
Usually, in different oil quality control applications of various industries, measurements are usually performed in accordance with standard methods issued by the American Society for Testing and Materials (ASTM) or the German Standards Institute (DIN). These methods usually indicate a specific pathlength. For example, the following standard method:
ASTM D7414
Standard Test Method for Condition Monitoring of Oxidation in In-Service Petroleum and Hydrocarbon Based Lubricants by Trend Analysis Using Fourier Transform Infrared (FT-IR) Spectrometry
ASTM E2412
Standard Practice for Condition Monitoring of In-Service Lubricants by Trend Analysis Using Fourier Transform Infrared (FT-IR) Spectrometry
ASTM D7415
Standard Test Method for Condition Monitoring of Sulfate By-Products in In-Service Petroleum and Hydrocarbon Based Lubricants by Trend Analysis Using Fourier Transform Infrared (FT-IR) Spectrometry
ASTM D7624
Standard Test Method for Condition Monitoring of Nitration in In-Service Petroleum and Hydrocarbon-Based Lubricants by Trend Analysis Using Fourier Transform Infrared (FT-IR) Spectrometry
ASTM D7418
Standard Practice for Set-Up and Operation of Fourier Transform Infrared (FT-IR) Spectrometers for In-Service Oil Condition Monitoring
Pearl ™ liquid sample cell provides different optical pathlengths for selection. The removable liquid cell module, Oyster™ , come in two configurations, one with a parallel window arrangement and another with ‘wedged’ windows, where a very small angle is allowed between the planes of the two windows. Doing so prevents the appearance of so-called ‘fringing’ (or etalon) effects in the spectra recorded with the cell which result from multiple reflections between two parallel windows.
Since the periodicity of the fringing is related to the distance between the two windows, this is the principal method of accurately determining the pathlength of a transmission cell.
From the fringing pattern obtained in an empty cell, the pathlength of the cell can be calculated from the following formula:
P = 5000 n / (ν1–ν2)
Where: P = path length (in microns)
n = number of stripes
ν1 = wave number of the first peak (in cm-1)
ν2 = wave number of the second peak (in cm-1)
For more detailed specifications of the Pearl ™ liquid sample cell, please visit the Pearl ™ liquid sample cell product page, or Contact ACTTR for more information.