")
")
Understanding Spectrophotometer (4) Quantitative Analysis
Introduction to Quantitative Analysis
Quantitative analysis is an important function of a spectrophotometer. By measuring the absorbance of a solution with specific solute, one can determine its concentration. The fundamentals of quantitative analysis of a spectrophotometer is based on Beer-Lambert Law, when the light beam passes through a transparent container (typically cuvette) with a fixed path length, the light intensity is attenuated on the other side of the cuvette. During the journey of light beam, part of the light was absorbed by the sample and the cuvette.
Principle of Quantitative Analysis
The reduced intensity of light after passed through the sample is linearly related to the thickness of the hollow portion of the cuvette, which is equal to the length of the sample. And the material of the cuvette, and the concentration of the sample itself will also influence the absorbance of the cuvette. When the size and the material of the cuvette is fixed in the measurement. So, like the zeroing process of a scale net weight, one can also zeroing the quantitative measurement of a spectrophotometer, by subtracting the absorbance of the cuvette and the blank solvent. The concentration of the substance is measured.
Some substances, which are transparent without color (nor UV, NIR), which cannot be quantified by a spectrophotometer. In the case, we can add a color developer, such as a phenol red indicator for pH measurement, which reacts with the substance and raise up a specific color. After the substance is colored, its concentration can be measured. Some samples may have multiple substances and more then one of them can be colored at the same time. The other substances will influence the result of the measurement of the target substance. We call these substances interference. Using reagents to remove or precipitate these interference is necessary in the quantitative analysis. We call the process purification or extraction.
Quantitative Analysis by Spectrophotometer
Spectrophotometer is an effective and economical quantitative analysis instrument, especially for those substances that are monotonous and colored (can be analyzed by a single wavelength absorbance measurement). A spectrophotometer is not only simple and easy-to-use, but also a relative low cost of instrument, compare to a GC/HPLC or ICP. The quantitative accuracy of a spectrophotometer is typically in ppm level, and in some situation with well controleled variations, can even in ppb level. As long as the substance in the solution does not have light scattering behavior (with microparticles) nor fluorescence, and it does not react by the light, the laboratories for daily research. In industries, a spectrophotometer is also useful in quality assurance process, because most of the substanced to be tested are known with controlled conditions. For example, the quality control of the compounds of hexavalent chromium, residual chlorine in water, nitrates, sulfates, phosphates, and so on.
Quantitative Analysis Operation - Select A Wavelength
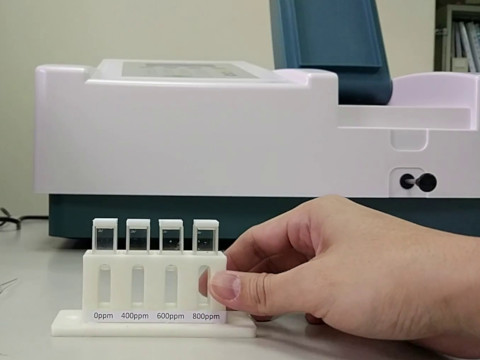
A translucent sample solution with a specific color, or colored after certain purification or extraction treatment has its darker or lighter color according to the concentration, which can be measured by a spectrophotometer with a specific wavelength (a color). And the desired darkest level, won't cause the saturated measurement. By scanning the complete wavelengh range with a spectrum, we can find out a proper wavelengh for quantitative analysis.
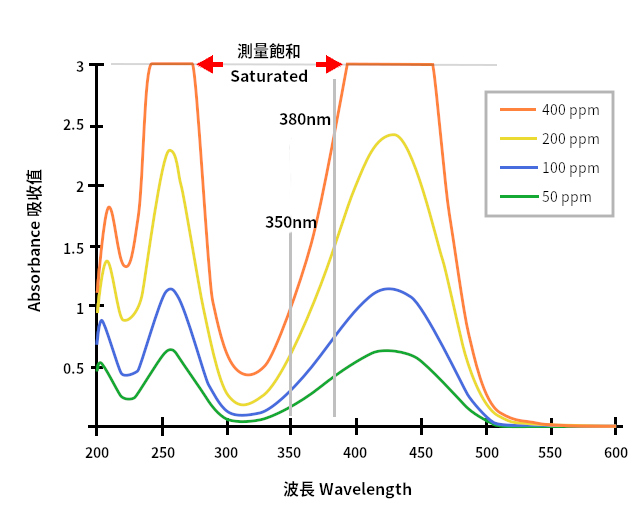
Taking the above spectrum for example, the four lines in the figure belongs to four concentrations of a food dye solution. The spectrum is measured by a UV1800 UV-Vis spectrophotometer by full-wavelength scanning function. In the figure, the position of 400 nm wavelength not a good choice, because the 400 ppm food dye is saturated. On the other hand, at the wavelength of 350nm and 380nm are proper selections for quantification, and 380nm looks better, because it has longer distance between two lines. A longer distance means more details when we are going to spit the measured absorbance value into a more details. It means more accurate than the one at 350nm.
Besides, FDA or ASTM typically announced some standard test method by spectrophotometers. In the public documents, one can have the existed preparation method, as well as a proper wavelength to be selected in the measurement, it saves the time in the fumble.
Quantitative Analysis Operation - Calibration Curve
A Calibration Curve is generated by measuring the absorbance of several solutions with different concentration, at least 3 different concentration, but ideally is 5 in order to get an objective slash from the connected points by linear regression regression in the concentration-to-absorbance fiture. ACTTR Technology brought to you the best spectrophotometer with Windows(r) based spectrum workstation PC software. It has a automatic calibration curve generation process, which can help you to save a lot of time.
Quantitative Analysis Operation - Interpolation Results
The slope of the calibration curve is actually the ratio of the absorbance and the concentration. The absorption value measured from an solution with unknown concentration can be multiply by the slope of the calibration curve, and the concentration is obtained. The concentration of this sample shall not exceed the range of the calibration curve, because the interpolation calculation can be more reliable this way.
At present, there are many announced measurement methods of a spectrophotometer in public and can be searched by Google, such as formaldehyde, nitrate, nitrite, sulfate, chlorophyll, lycopene, iron, total phenol, chlorine, ammonia, barrageen, pesticides (enzyme coloring method), sulfides, cyanide, phosphate, hexavalent chromium, surfactants, and so on.
If you need more product consultation about spectrophotometer, or want to know more efficient quantitative measurement methods, please Contact ACTTR. We're more then happy to help you.
Previous: Understanding Spectrophotometer (3) Internal Structure
Next: To Be Continue