")
")
Understanding Spectrophotometer (3) Internal Structure
A spectrometer, usually measures the absorption characteristics and intensity of light via the following steps:
- Disperse the light into shades of different colors
- Pick up a color light with a specific wavelength (single color light)
- Pass this single color light through the sample
- Measure the intensity of light with a digitized value, from the output side of the sample
- Obtain the absorption value of this single color light
To plot a complete absorbance spectrum from a range of wavelengths, one can simply divide this wavelength range into a certain wavelength scales. For example, with a 1nm scale, one can obtain 11 single wavelengths, from 380 nm to 390 nm wavelength range. Repeat the above steps, the absorption of each wavelength can be measured and recorded. Connect these results with wavelength in X-axis wavelength and absorption in Y-axis, we can get a curve of absorption spectrum.
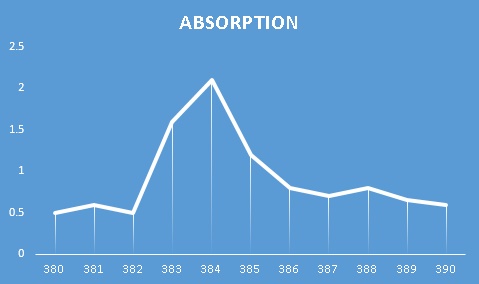
Connect Each Point of Absorption Value And Have The Spectrum
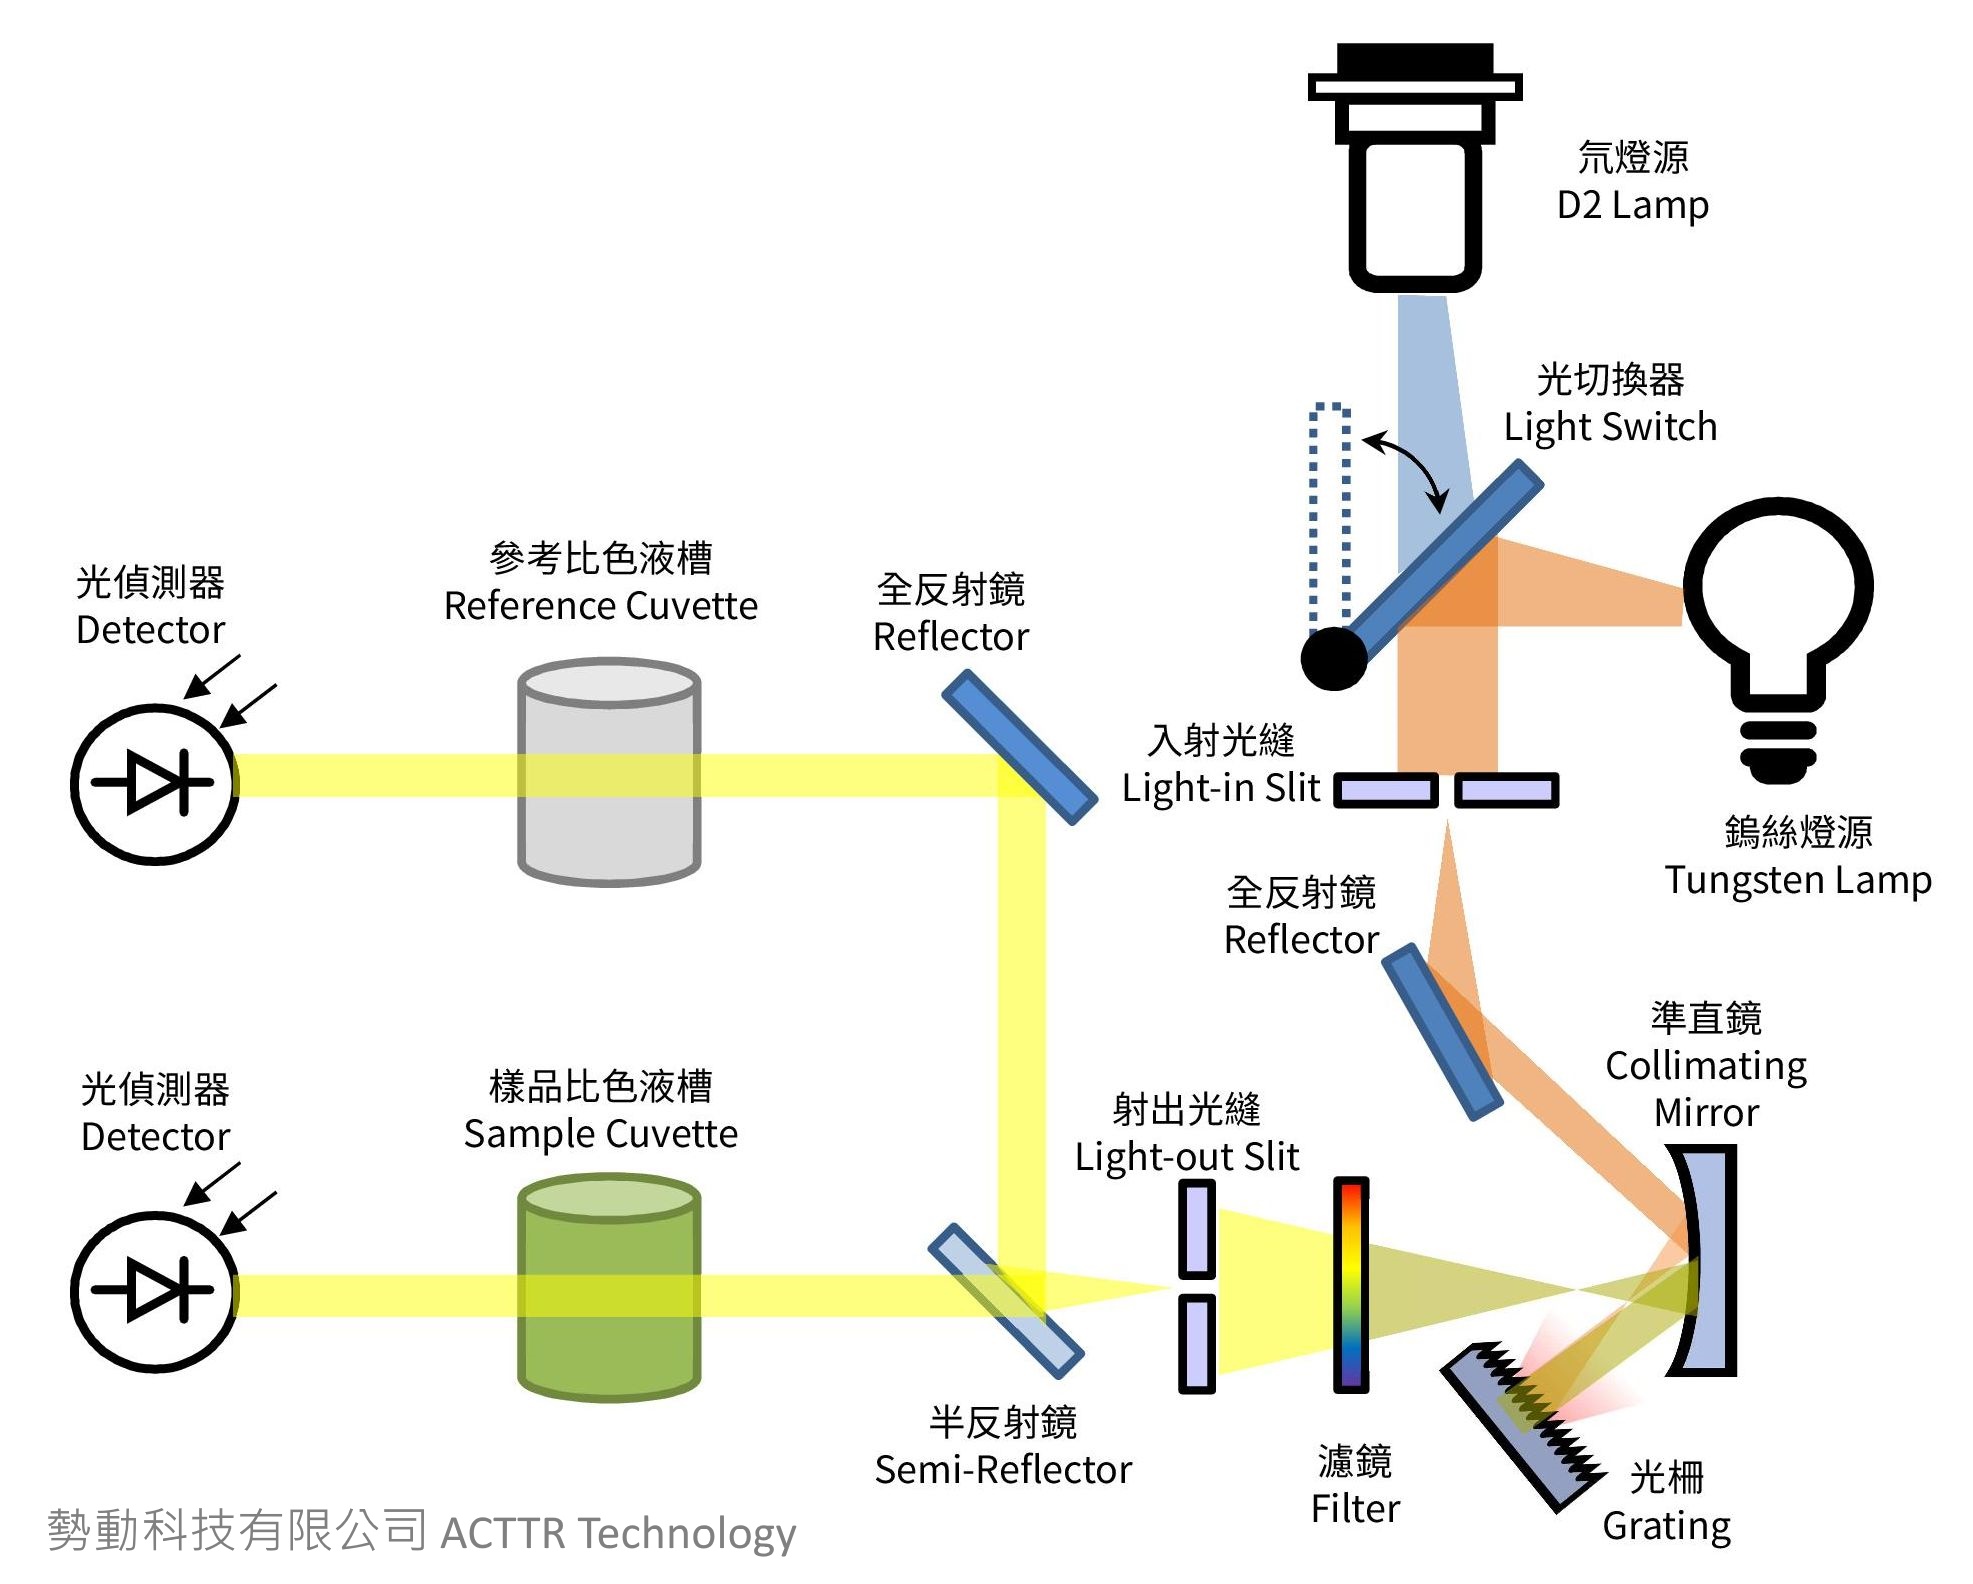
The below figure shows the structure of a spectrophotometer. The upper right corner is the light source of lamps. The light travels some optic devices, such as mirror, grating, mirror, slit, and then pass through the sample tube (cuvette). Later, the light detector reads the light intensity and the analog signal of the intensity will be converted into digital values via a A/D converter. And finally the values or spectrum can be presented onto the screen of the instrument. Or it can be transmitted to a computer via USB. And the spectrum workstation software can do some sophisticated analysis, cartography, generates reports, or store the value in a file for further scientific analysis or statistical analysis, such as Excel® or Matlab® software.
分光光度計的內部構造
Beam Splitting Unit (Optical Unit)
Light Source
The common light source of a spectrophotometer are tungsten halogen lamp (for visible light), deuterium lamp (for UV light), xenon lamp (visible + UV). Read " What Are The Types of Lamps in An UV-Vis Spectrophotometer?" article, for more information.
Light Source Switch
It is used to sequentially switch the UV light source and visible light source. Combine the two segments into a complete UV-Vis wavelength from 190nm to 1100nm, in general.
A Reflection Mirror Rotated by A Motor
Light-in Slit and Reflection / Collimating Mirror
Before the light been spitted into single color beam, the original light from the lamps can be preprocessed into a straight parallel light by these optic devices.
Grating
The surface of a grating is a jagged mirror. It is used to disperse the original color-mixed “white light” into several individual color light. In a conventional spectrophotometer, it is used to set up a prism for this purpose. Today, in most of the spectrophotometers, it is replaced by a more precise and more stable gratings.
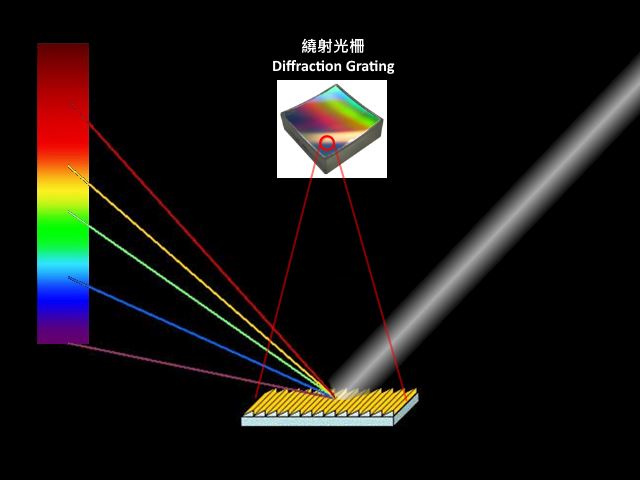
A Diffraction Grating Looks Like A Mirror. But The Surface Is Jagged
Collimating Mirror, Light-out Slit
After the white light is dispersed into pure individual colors, the light is unfolded like a folding fan. By rotating the angle of a collimating mirror, a specific wavelength of the color light can be aligned on the light-out slit. After the color light passing through the slit, the unwanted wavelengths are filtered out, and a single pure light is produced. The location of the filter can be in different sequence and place in the optic path, according to the design.
Note: Although in the above description, the word "pure single color light" is used, in fact, the spectrum of the light is continuous over the entire wavelength range. That is, a single color light of a 533 nm beam we obtained, may still contain the wavelength of 532.09 nm or 533.01 nm. It is still “impure”, we can only try our best to make it a bit purer.
A real spectrophotometer is often not as simple as a single slit. So in some descriptions, we use the term “monochromator” to describe a set of optic devices, which purify a single color beam.
Sample Unit
Cuvette
A cuvette is a container for liquid samples, with a opened square hole on the top, for pouring into the sample. The general materials of a cuvette can be glass, quartz (for UV), or plastic, and so on. The width of a cuvette affects the path length of the beam getting through the sample, resulting in different absorbance. The most common cuvettes are 10mm (1cm) wide. Some “micro cuvettes” are designed for tiny amount of samples, such as DNA and RNA samples. Or some long optical path, 10cm wide cuvette for low concentration samples.
Cuvette Holder
The cuvette is placed on the cuvette holder, which is usually a four-channel manual pull-push holder with a rod for four cuvettes. There are hollowed-out holes on the sides of the holder, which allow the beam to pass through the sample. There are also automatic cuvette holder in some higher end spectrophotometer, which switches the cuvettes one by one automatically, by the preset program.
A 4-Unit Manual Cuvette Holder, Accepts Four Cuvettes Insertion
Light Detection & Processing Unit
Light Detector
The most common light detector is silicon photodiodes. Compare to the image sensor on a camera, the detector on a spectrophotometer has much fewer pixels, but more sensitive with lower noise. The signal outputs from the photodiode is voltage, which is an analog signal. So, it will need an analog to digital converter (A/D converter), in order to digitalize the intensity of the light. At present, the light sensor is typically integrated with the A/D converter on the same PCB.
Digital Signal Processor
ARM processor is generally designed in the spectrophotometer as the digital signal processor.as the mobile phone. The processor can process the digital signals from the light sensor, and simultaneously control the step motors and moving parts in the instrument. The result received from the light detector is processed a series of absorbance values that the user can read.
Display & User Interface
LCD Screen & Keyboard
LCD screen has different size and resolution on a spectrophotometer. A lower-end spectrophotometer has a smaller screen. One can read the absorption value from few lines of characters displayed. And one can key in some operation parameters via the thin film keyboard. On a high-end spectrophotometer, the resolution of screen accepts the spectrum to be displayed directly. And the operation can be down via the touch screen. No keyboard is needed.
USB Connection
Some spectrophotometers, designed a USB sockets, which allows the users to connect the spectrophotometer to a computer. Or one can insert an USB stick to export measurement result. By connecting the spectrophotometer to a computer, on can control the spectrometer via the software. And one can do some powerful functions in the software, such as finding the peaks, Fourier transform, and proceed some basic spectrum analysis in the software. After, output the result, draw a spectrum, or export a beautiful report to a PDF file, and so on.
Other Details
In addition to the above basic structure of a spectrophotometer, there are more details in the design, in order to improve the measurement result and make it better. Either the arrangement of the path of beams, the accuracy of step motors for optic parts motion/rotation, or the selection of lens and filters, they will influence the accuracy and the stability of the final measurement results. And some functions, such as system baseline calibration, blank absorption calibration, calibration curve, single wavelength measurement, spectrum scan, time dynamic measurement, etc. are also very important to save the experiment efforts..
ACTTR has great experiences in spectrometers and its technologies for many years. We brought to you the most cost-effective instrument from a large number of spectrophotometer manufacturers in the world, and give you the same powerful and precise features, with a lower affordable cost, which can easily meet your budget. And you will have excellent user experience. For more product information of spectrophotometer, please visit ACTTR Spectrophotometer Product page. Or Contact ACTTR right away. Our professional members will provide you all the necessary consultant.
Previous: Understanding Spectrophotometer (2) Function & Application
Next: Understanding Spectrophotometer (4) Quantitative Analysis